Graphical mapping
Graphical mappings describe the mapping of the source to the target structure using a graphical editor. In other words, Graphical mappings are declarative mappings.
Concept
A graphical orchestra mapping is a mapping defined using a graphical editor. Actually there are three different subtypes:
-
The so-called Orchestra mapping is the standard graphical mapping with source and target types.
-
An IDOC mapping is a graphical mapping which transforms SAP-Messages of type IDOC_INBOUND_ASYNCHRONOUS to Messages defining the structures of SAP-IDOCs. This message types are imported directly from a SAP system. They contain additional information which is used from Orchestra to automatically create the complete mapping.
-
A Target_Only_Mapping is a special mapping having no source message but only an output message. It is typically used to create dummy messages or to create small messages using some parameters.
A graphical data transformation is called Graphical mapping. A mapping defines how data is transformed from a source message type to a target message type.
Creation of an Orchestra Mapping
-
To create an Orchestra Graphical Mapping, click on the plus icon located on the bottom left of the screen and click on Mapping.
-
Click on Graphical Mapping
-
Select Orchestra from the Script Type drop down.
-
Select the source message type, which defines the structure of the incoming data.
-
Select the target message type, which defines the structure of the output data.
-
Before creating the mapping, you are offered three optional configuration options:
- Create node mappings: Create node mappings automatically.
- Ignore case of attribute names: While creating node mappings, ignore case-sensitivity.
- Limit fields to maximum length: Automatically limit fields lengths.
-
Provide a meaningful and unique name for the mapping.
-
Optionally, enter a description to document the purpose or special logic of the mapping. This is helpful for future reference or for other users who work with your mapping.
Creation of an IDOC Mapping
-
To create a IDOC Graphical Mapping, click on the plus icon located on the bottom left of the screen and click on Mapping.
-
Click on Graphical Mapping
-
Select IDOC from the Script Type drop down.
-
Select Dispatch Mapping or Patch Mapping from the Type drop down, depending on your use case.
-
Select the source message type, which defines the structure of the incoming data.
-
Select the target message type, which defines the structure of the output data.
-
Adjust optional configuration parameters:
- Control-Record (IDOC)
- Control-Record (RFC)
- Data-Record (RFC)
-
Provide a meaningful and unique name for the mapping.
-
Optionally, enter a description to document the purpose or special logic of the mapping. This is helpful for future reference or for other users who work with your mapping.
Navigation
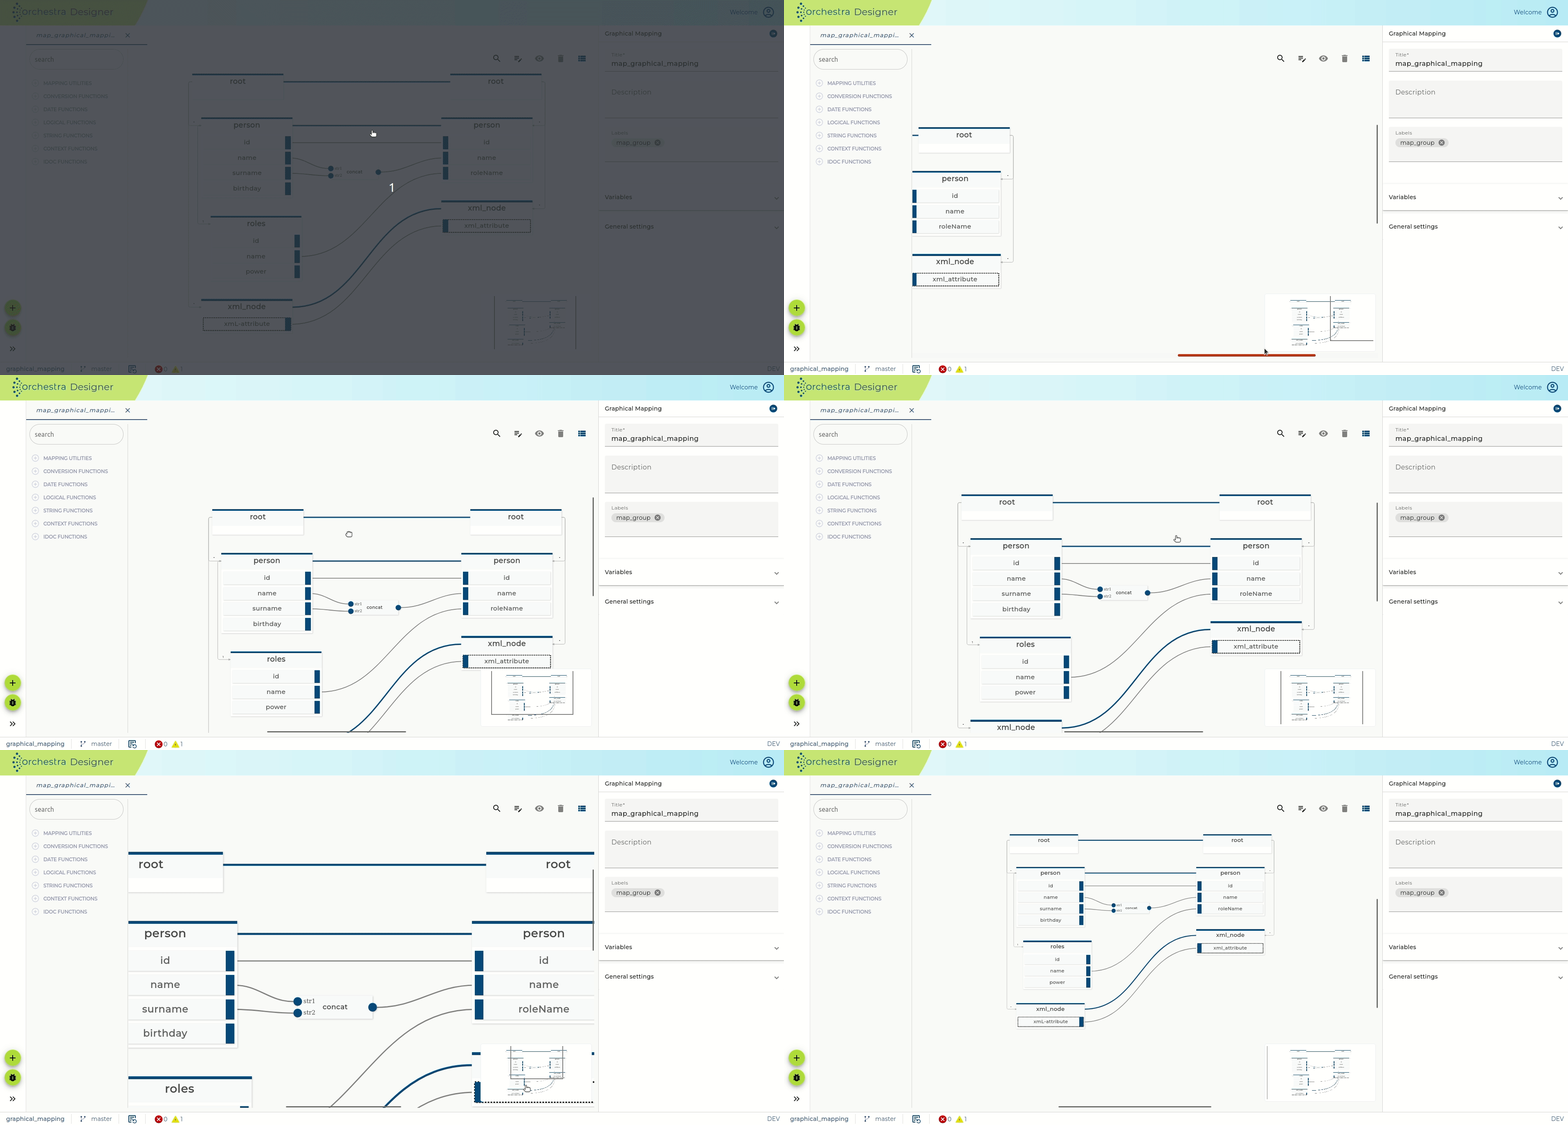
The Graphical Mapping is placed on and so-called endless paper. That means you can navigate in any direction without any restrictions, offering as much space as you need. To navigate withing the paper, you have several options:
-
Scrolling: At the right & bottom border of the paper are scroll bars placed to scroll in vertical or horizontal direction. You can also use your mouse wheel to scroll vertically.
-
Grabbing: Find a free space on the paper. Click that space & hold the click. Your cursor should be become a hand, indicating that you are now able to move the paper view port by holding the click & moving your mouse in the desired direction.
-
Zooming: You can zoom in & out to get a better overview by holding CTRL on your keyboard and scrolling with the mouse wheel.
-
Mini-Map: You can jump to some position by clicking on the mini-map.
Create connections
In general there are two ways to create a connection between nodes/ports:
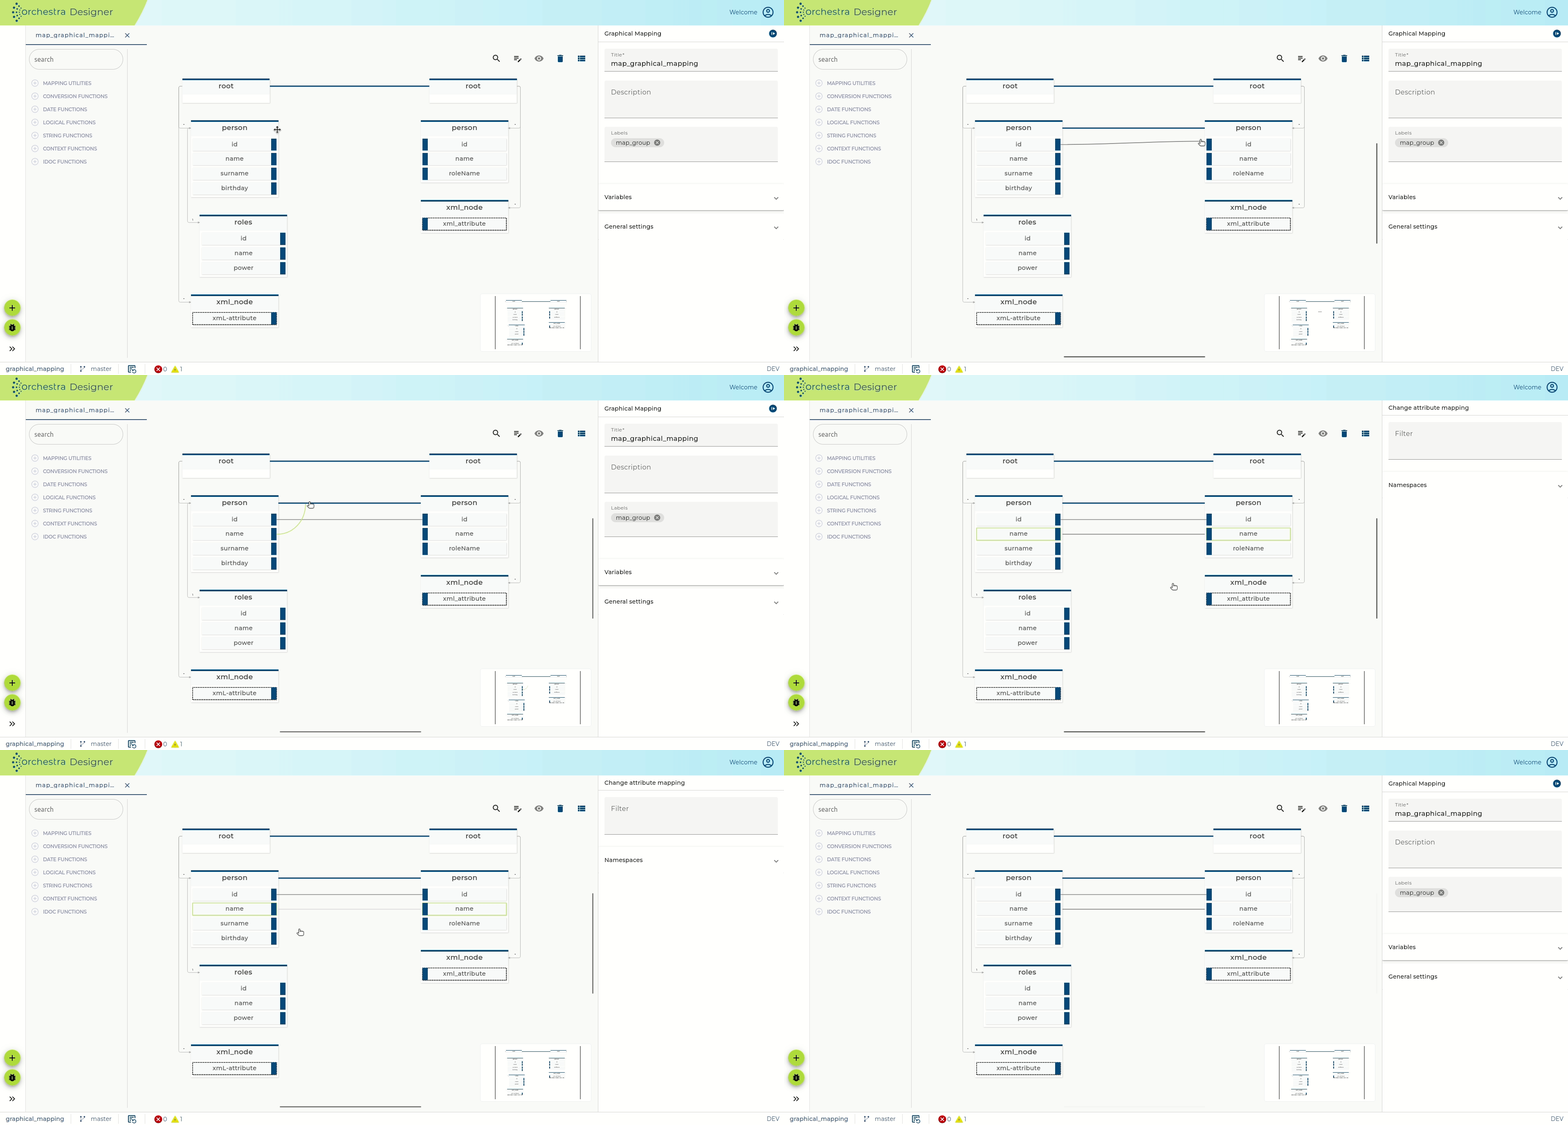
- Drag connection: Left-click a node or a port & hold the click. Start moving your mouse while holding the click. Move it to a desired node/port & release the click.
- Click connection: Left click anode or a port. You should see a green connection drawn from the node/port you clicked to your cursor. The green connection will follow your cursor until you confirm a connection by clicking left again on another valid target node/port. To cancel selecting a target nodes/port if you already selected a source, press ESC on your keyboard or simple right click.
Add functions
The Functions Panel provides a comprehensive list of available transformation functions. These range from simple operations—like string casting or arithmetic—to complex, user-defined logic. You can drag and drop these functions into your mapping to perform customized data transformations.
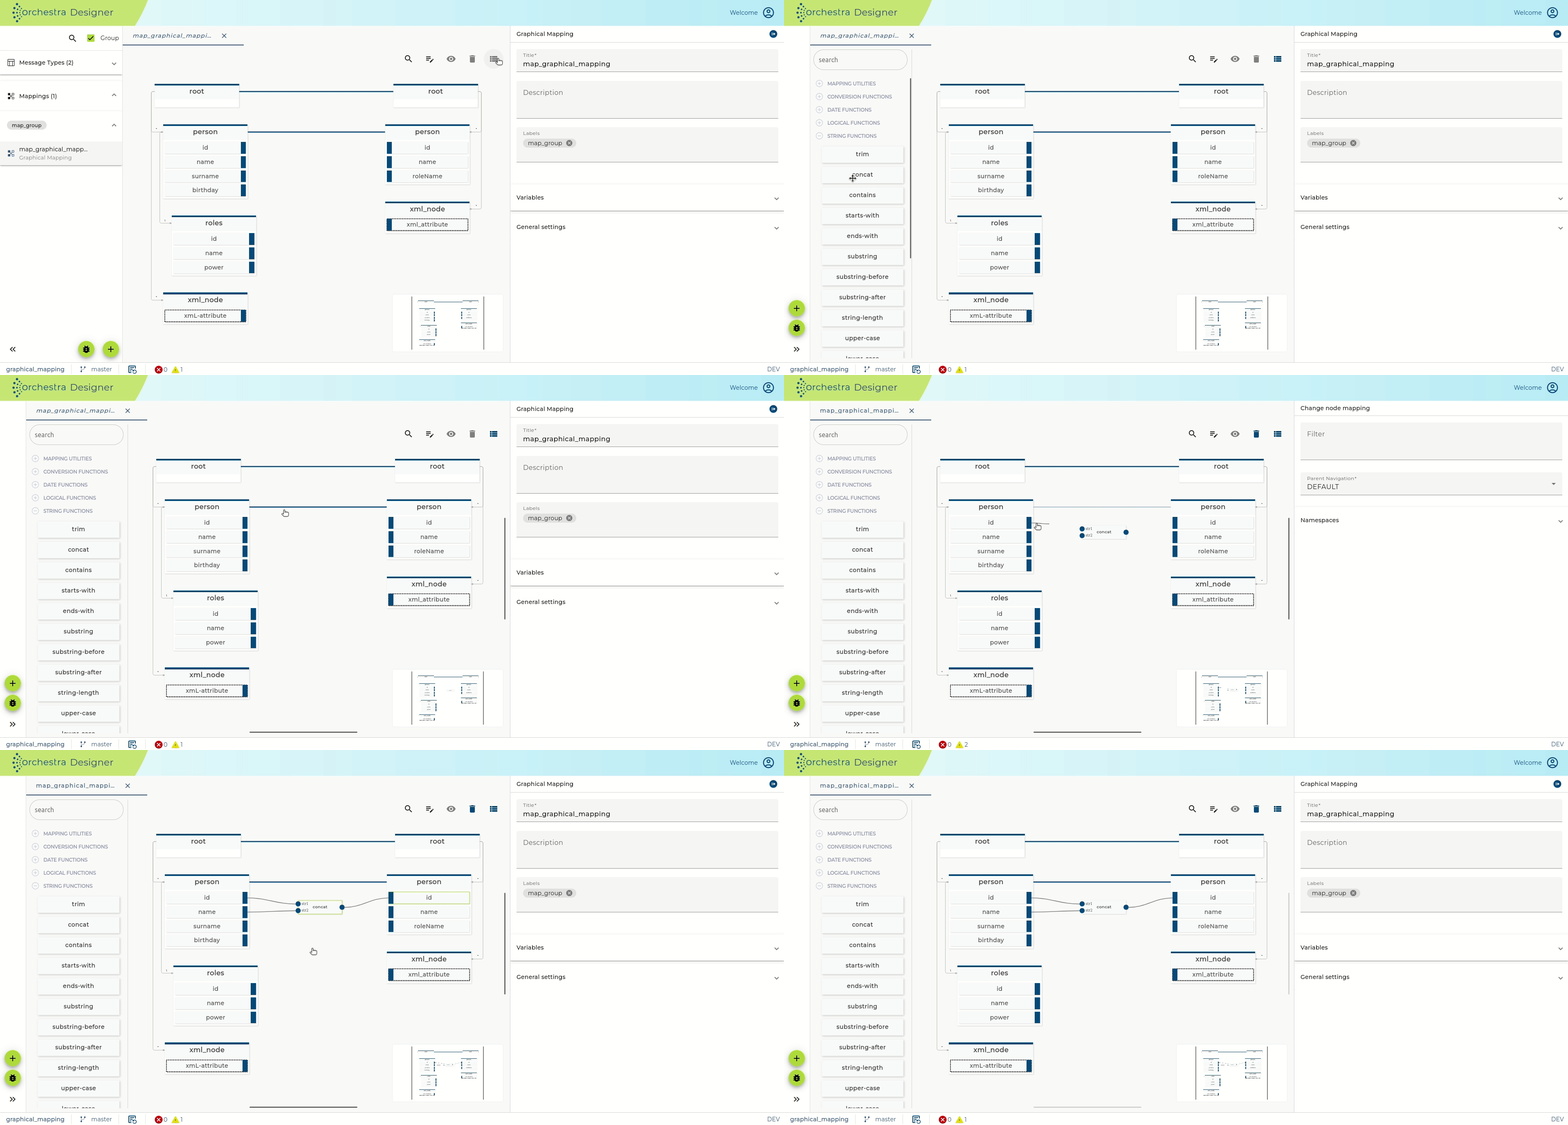
Remove connections/functions
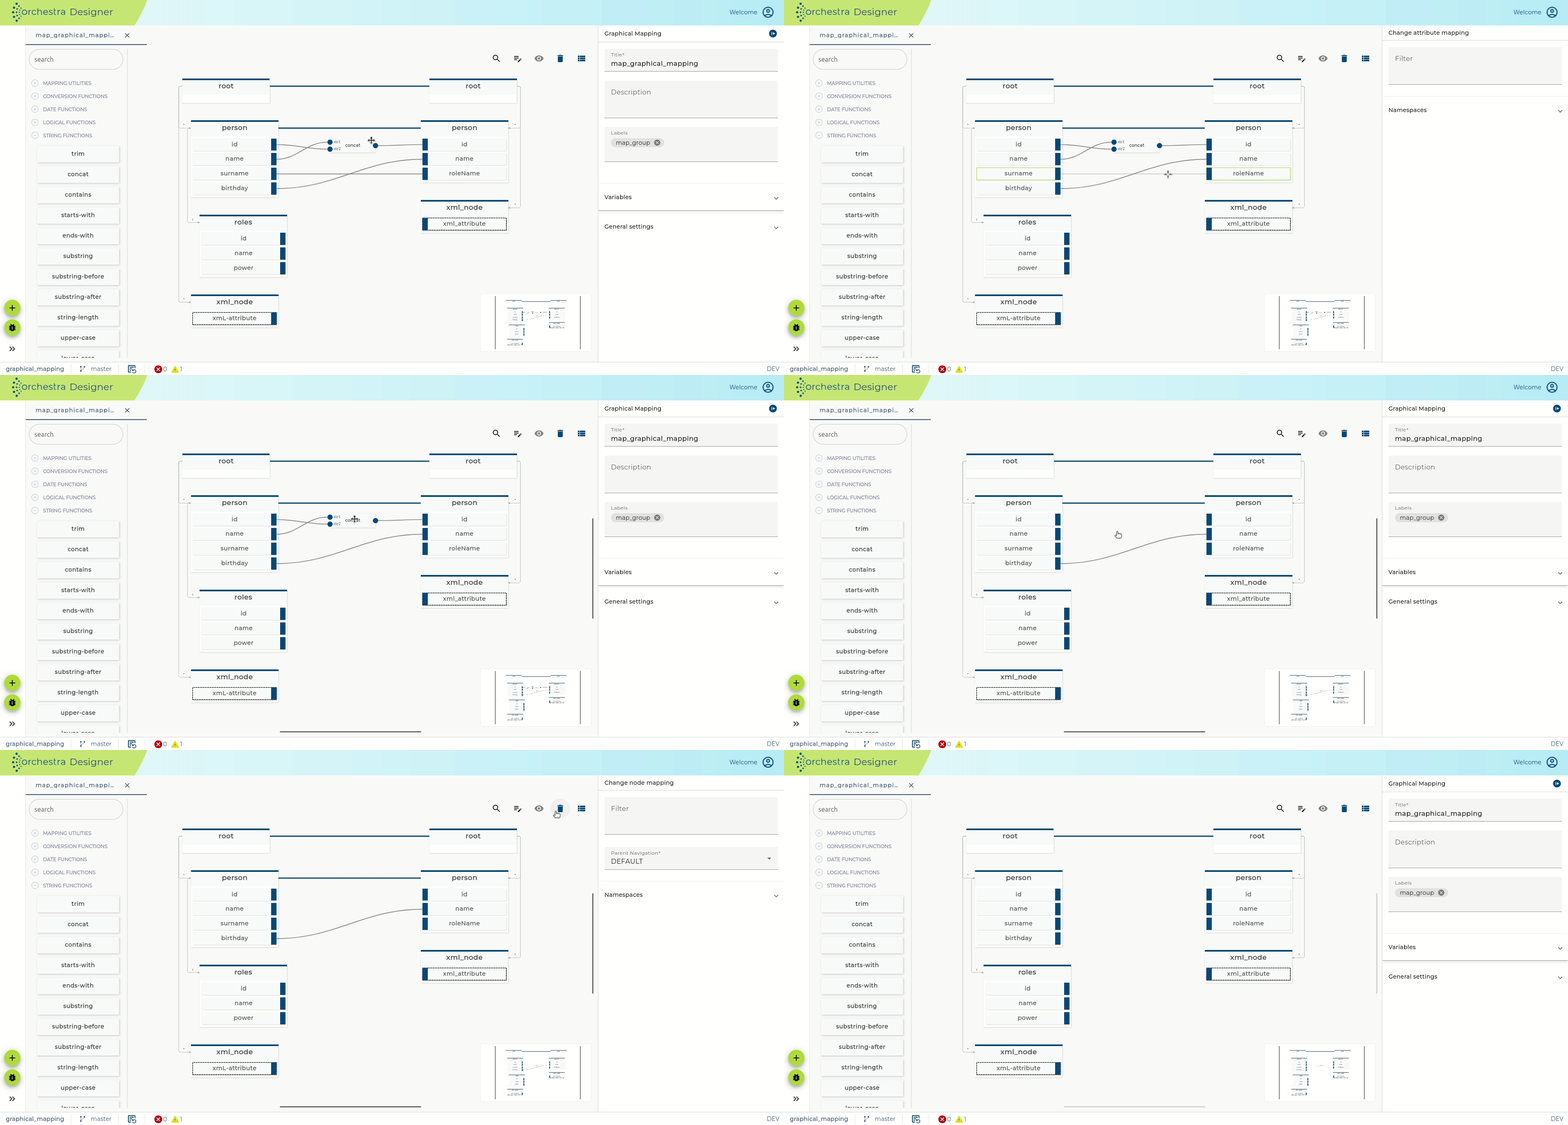
Connections & functions can be removed by selecting them and then pressing ESC on you keyboard or by using the trash button in the top right corner of the paper. Keep in mind that if you remove functions, its connections are remove too. Also removing node mappings removes also its value mapping & functions.
Use this tool to clean up or adjust your mapping as needed.
Search
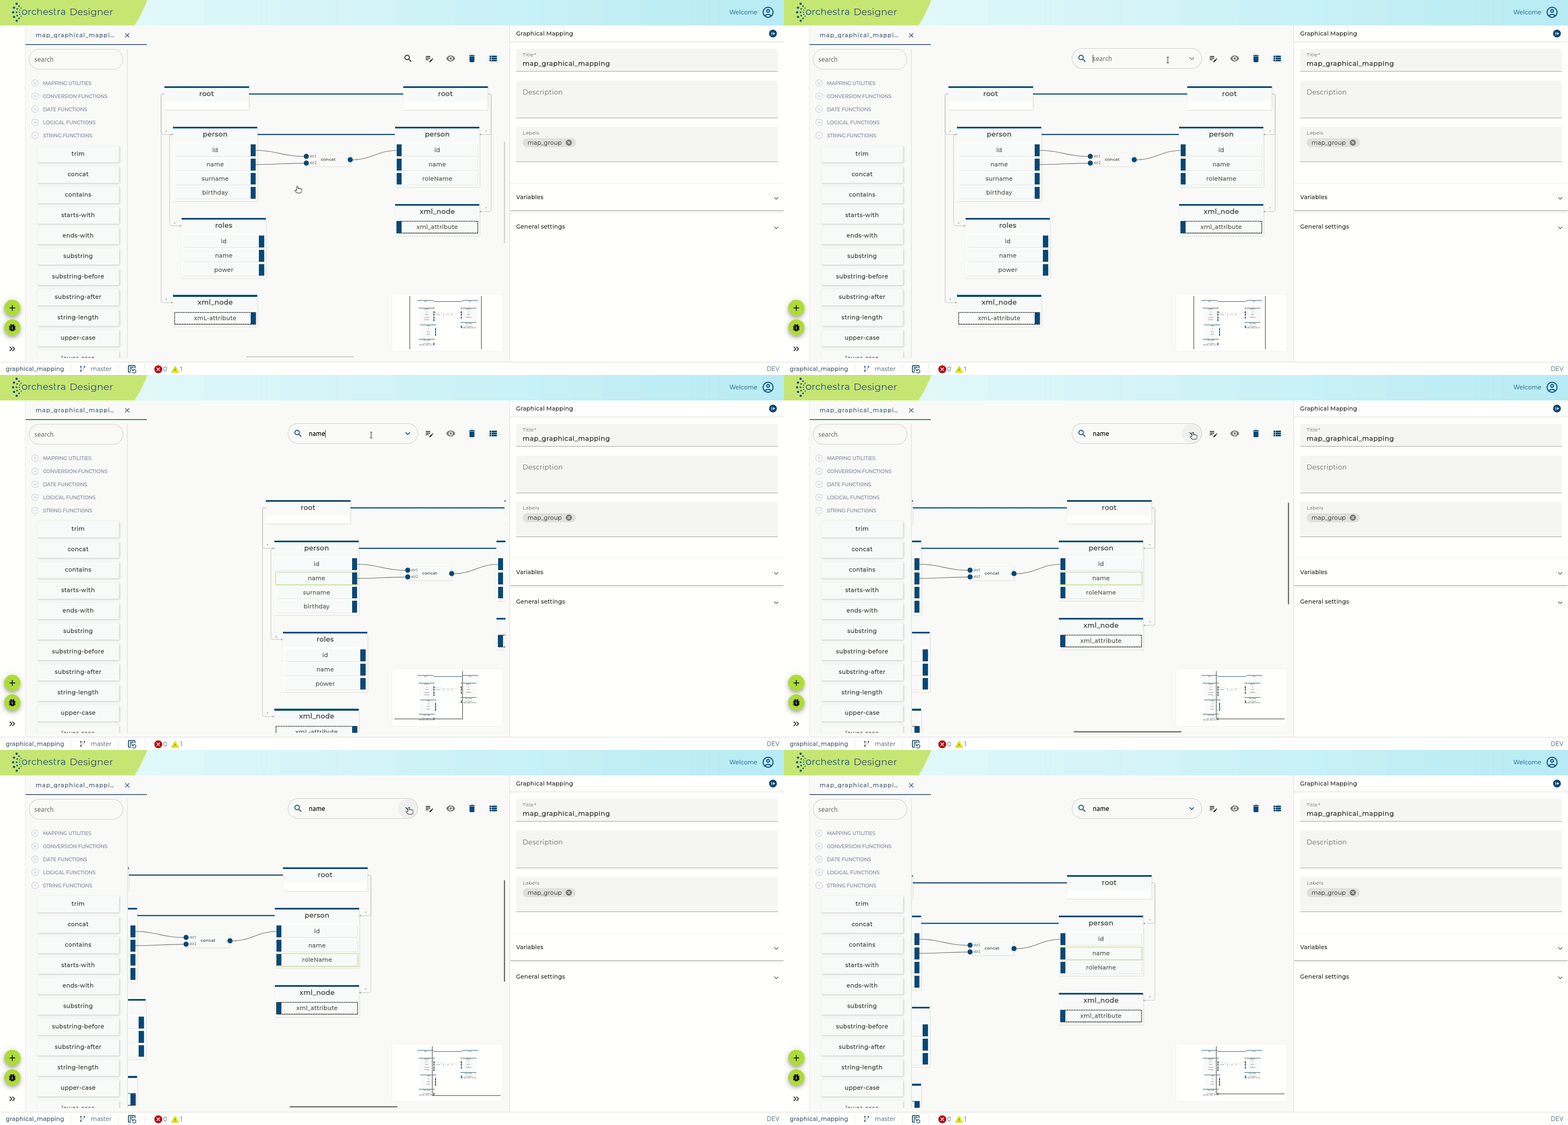
The Search function allows you to quickly locate elements within the entire structure of the source or target message. If multiple matches are found, you can navigate through each result step-by-step by pressing ENTER on your keyboard or using the arrow down button. This is especially useful for large or complex mappings.
Update Message-Type
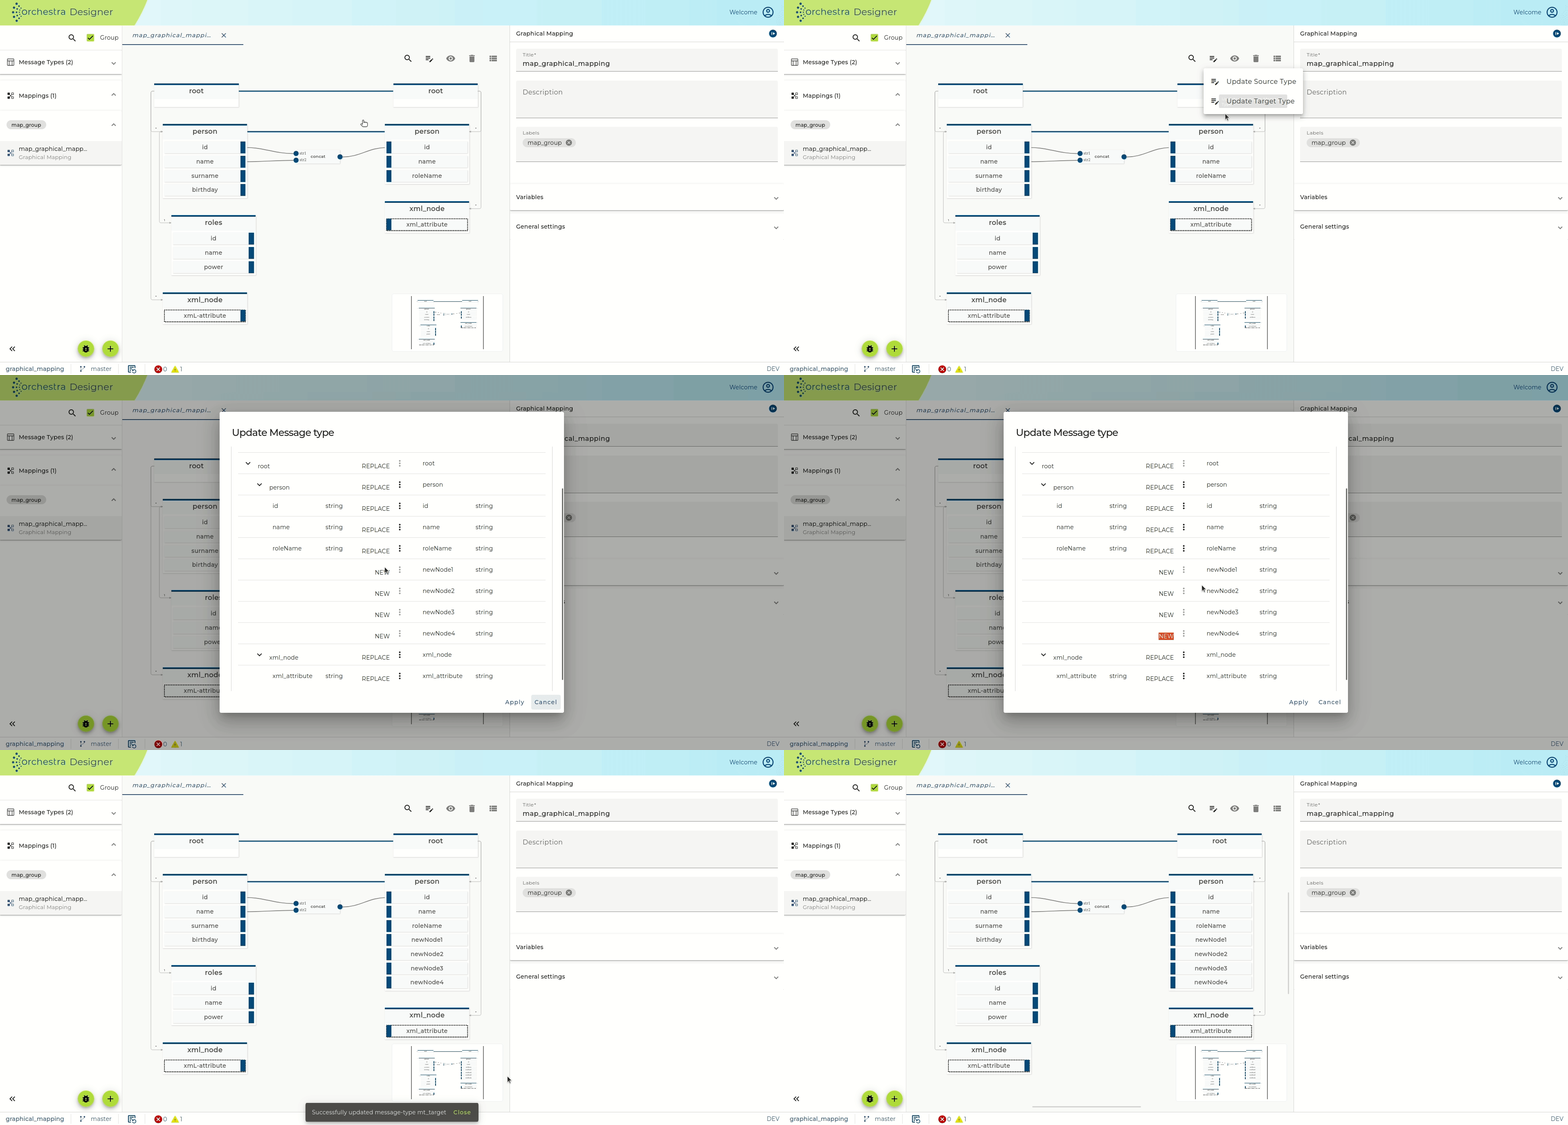
If you have updated a message type structure, which is used by a graphical mapping, you might want to reflect that change in it too. Press the edit list button in the top right corner of the paper. Select which message type you want to update. A dialog is shown with information about what will be changed. If a change is not automatically resolvable, the dialog will ask you to choose an appropriate action.
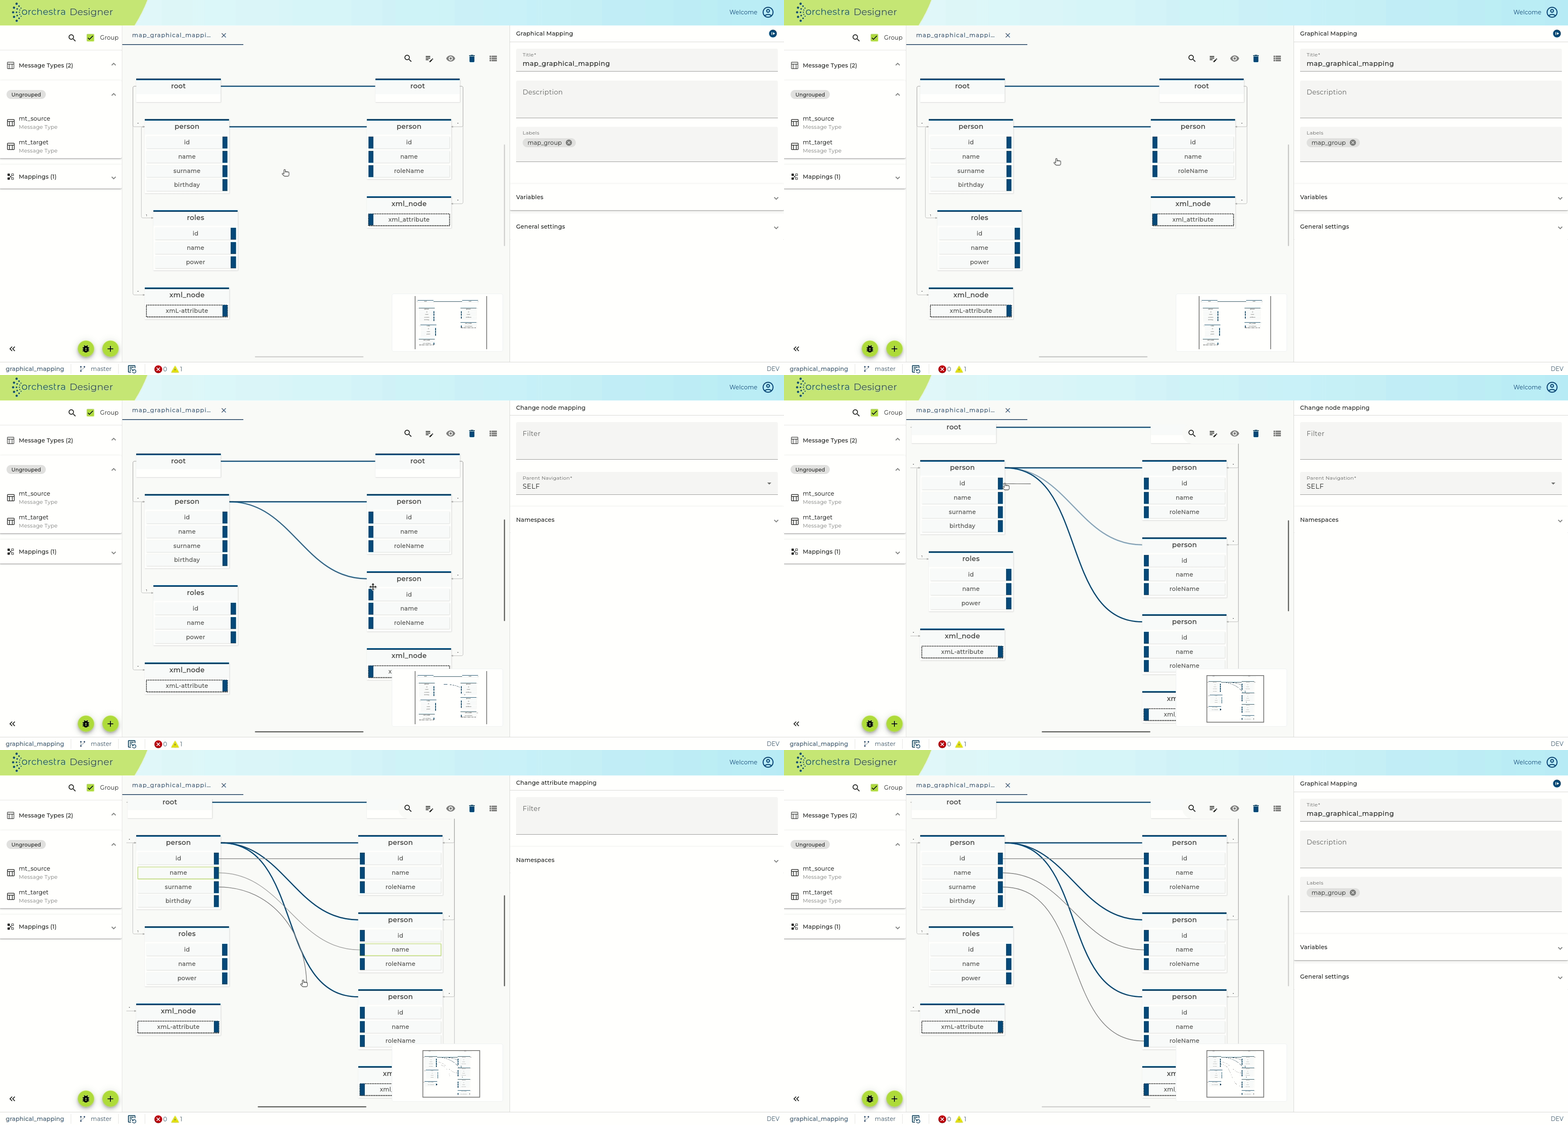
Create multiple node mappings for same target
In some cases you might want to create multiple node mappings for the same target node. This is possible by simply dragging another node mapping from the source to the same target node. This will automatically create a copy of the node under the original node and connect the node mapping to it. Now you have separate target nodes for each node mapping.
To remove such node mappings with its copied node, just select & delete the node mapping connection. The previously copied target node will be removed automatically.
Filters for attribute mappings
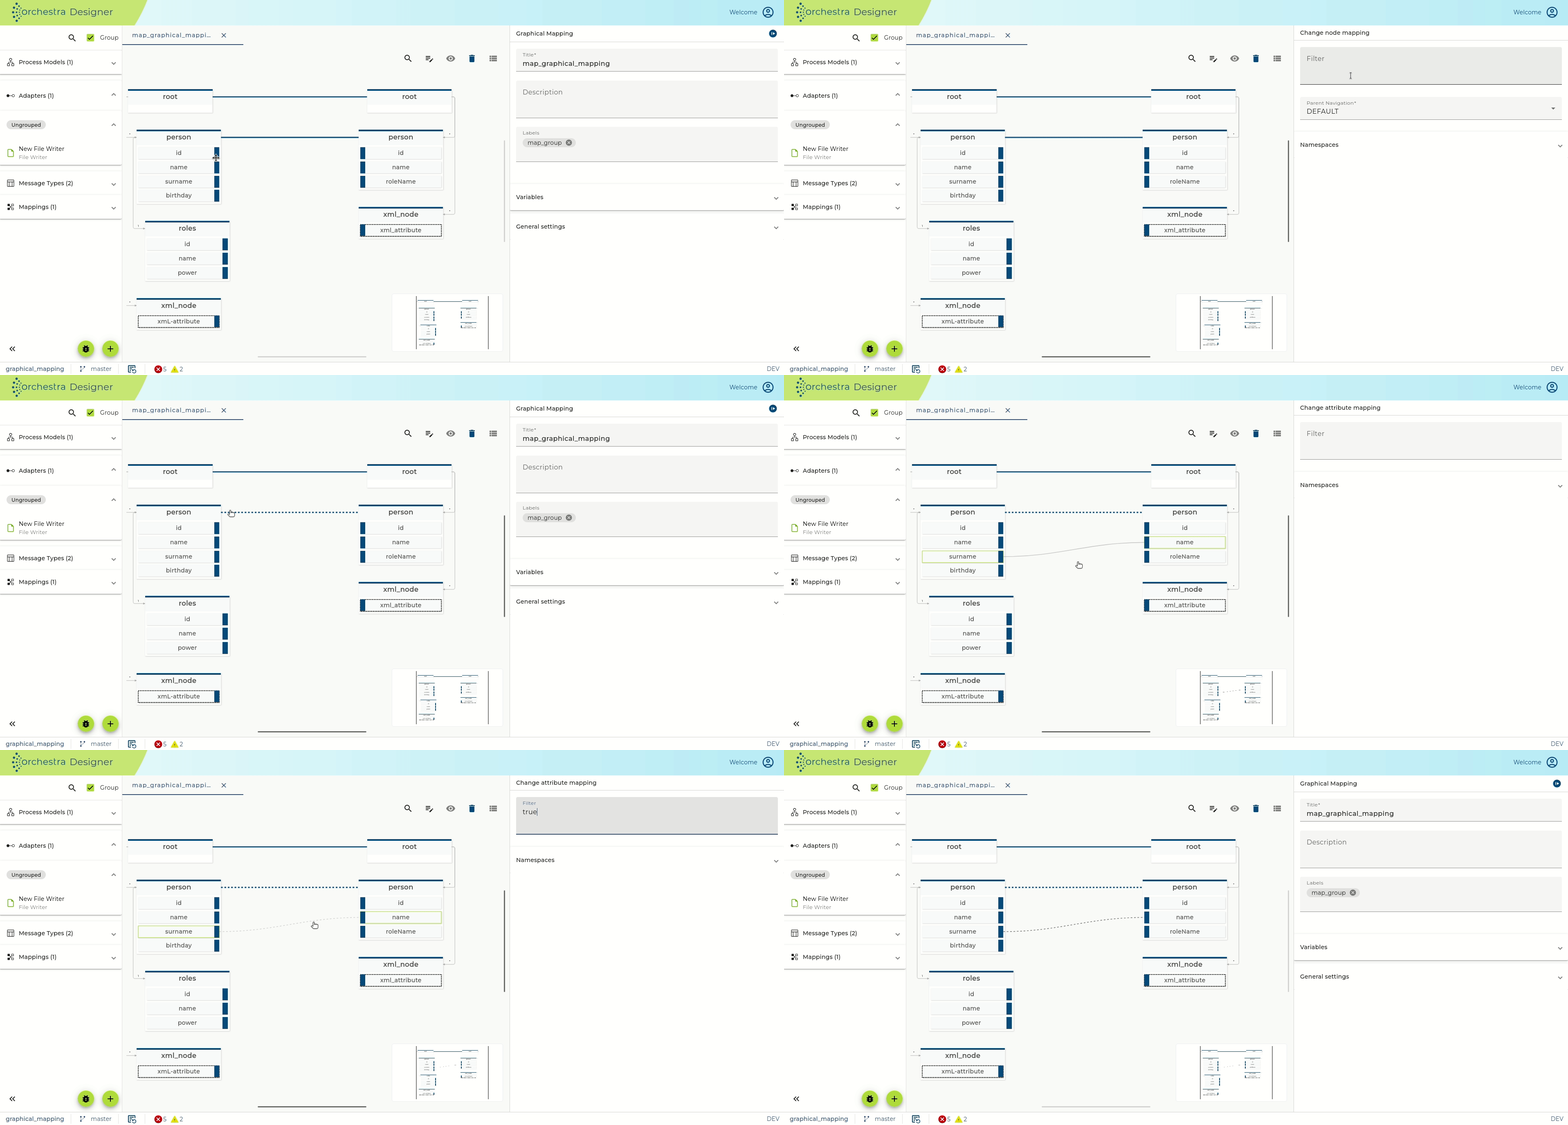
You may also set a filter on an attribute mapping if it shall be executed only under certain conditions. This might be necessary if the source of an attribute mapping has many values, and you want to select a single one fulfilling a particular condition.
A filtered attribute mapping is depicted by a dashed line.
Selecting & Highlighting
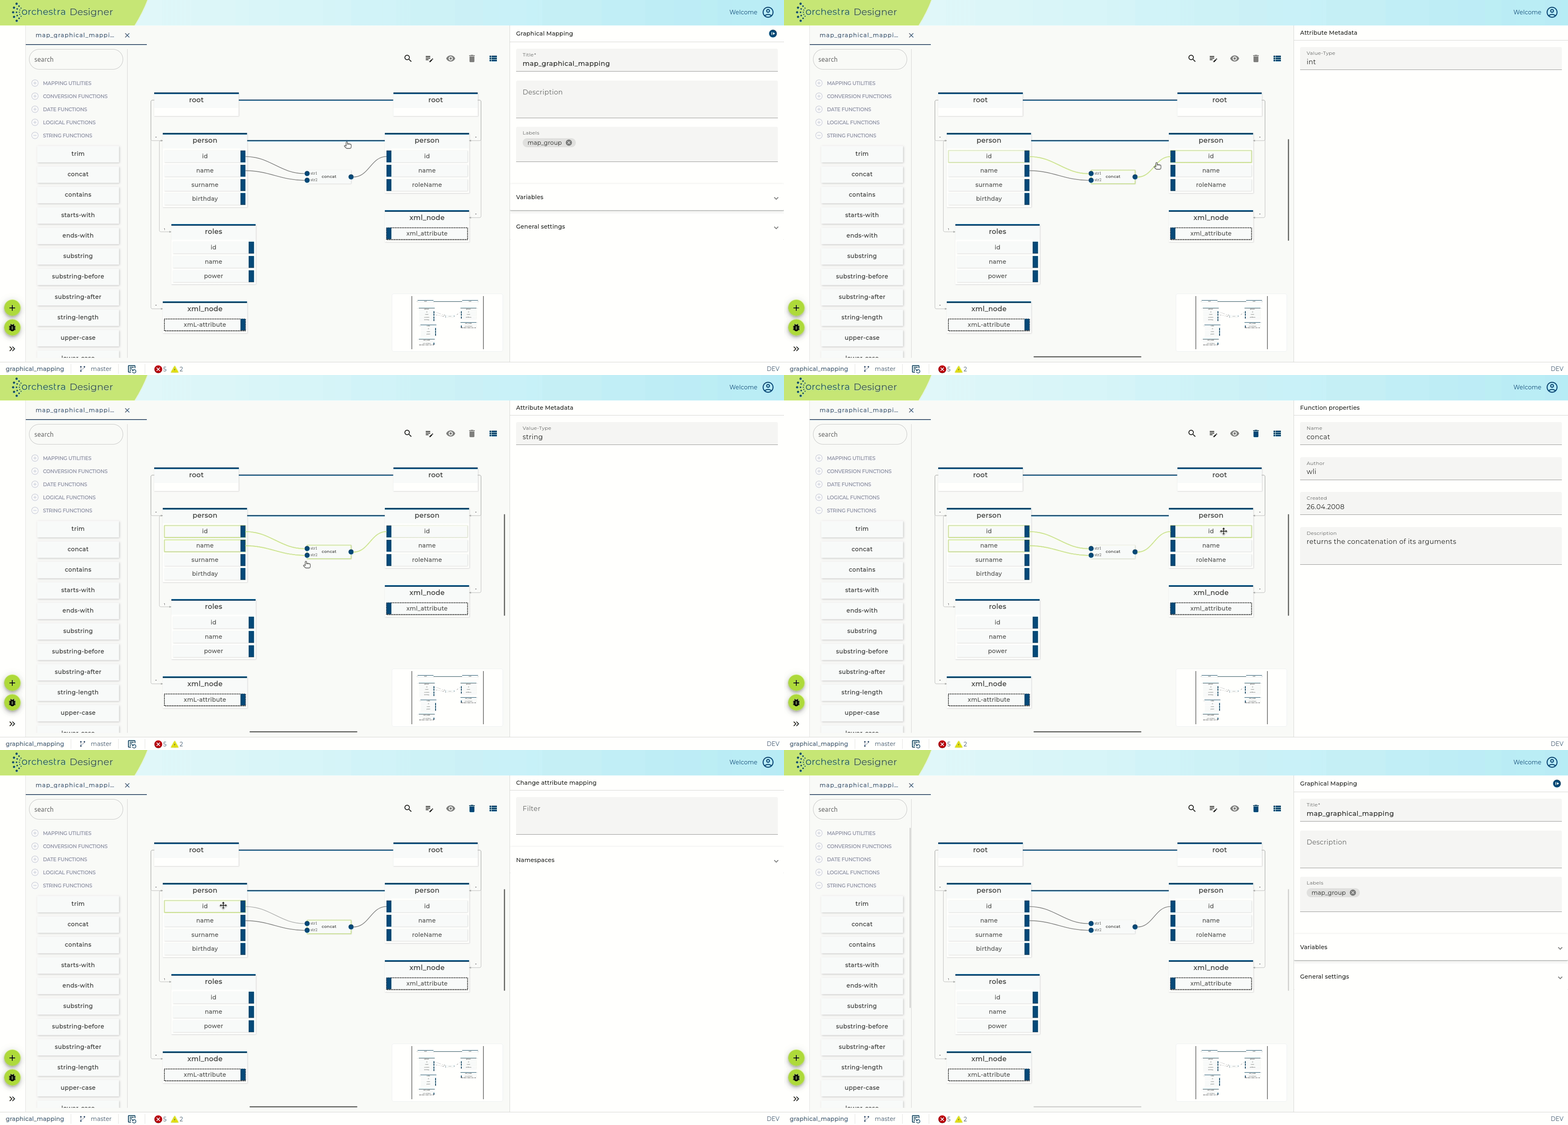
Selecting some elements shows additional information. These types of selections are possible:
- Attributes: Selecting an attribute shows additional information about the attribute in the right sidebar. It also highlights all connections, functions & attributes involved, if the attribute has in- or outgoing connections.
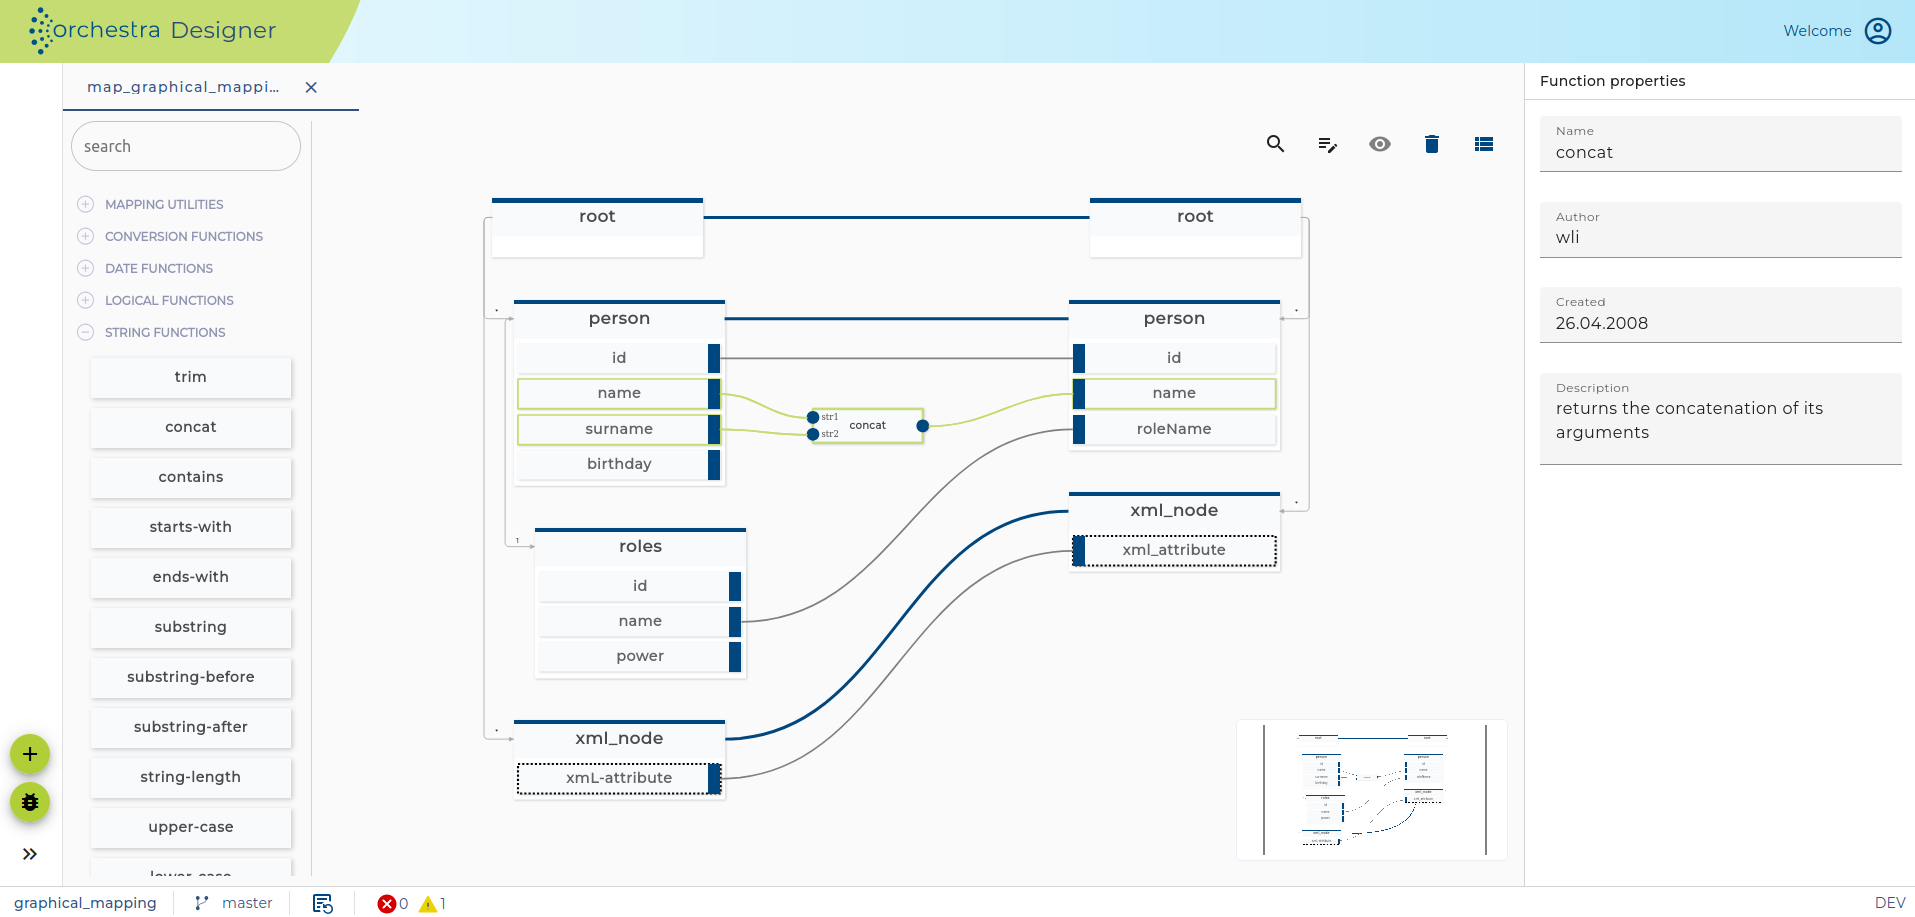
- Functions: Selecting a function shows additional information about the function in the right sidebar. It also highlights all connections, functions & attributes involved, if the function has in- or outgoing connections.
- Connections: Selecting a connection highlights the connection itself with a pulse effect and the first ancestor & predecessor with a green rectangle. Additional information, if any, is shown in the right sidebar. If you select a node mapping connection, all functions & connections from other node mappings are hidden.
Filtering & Spacing
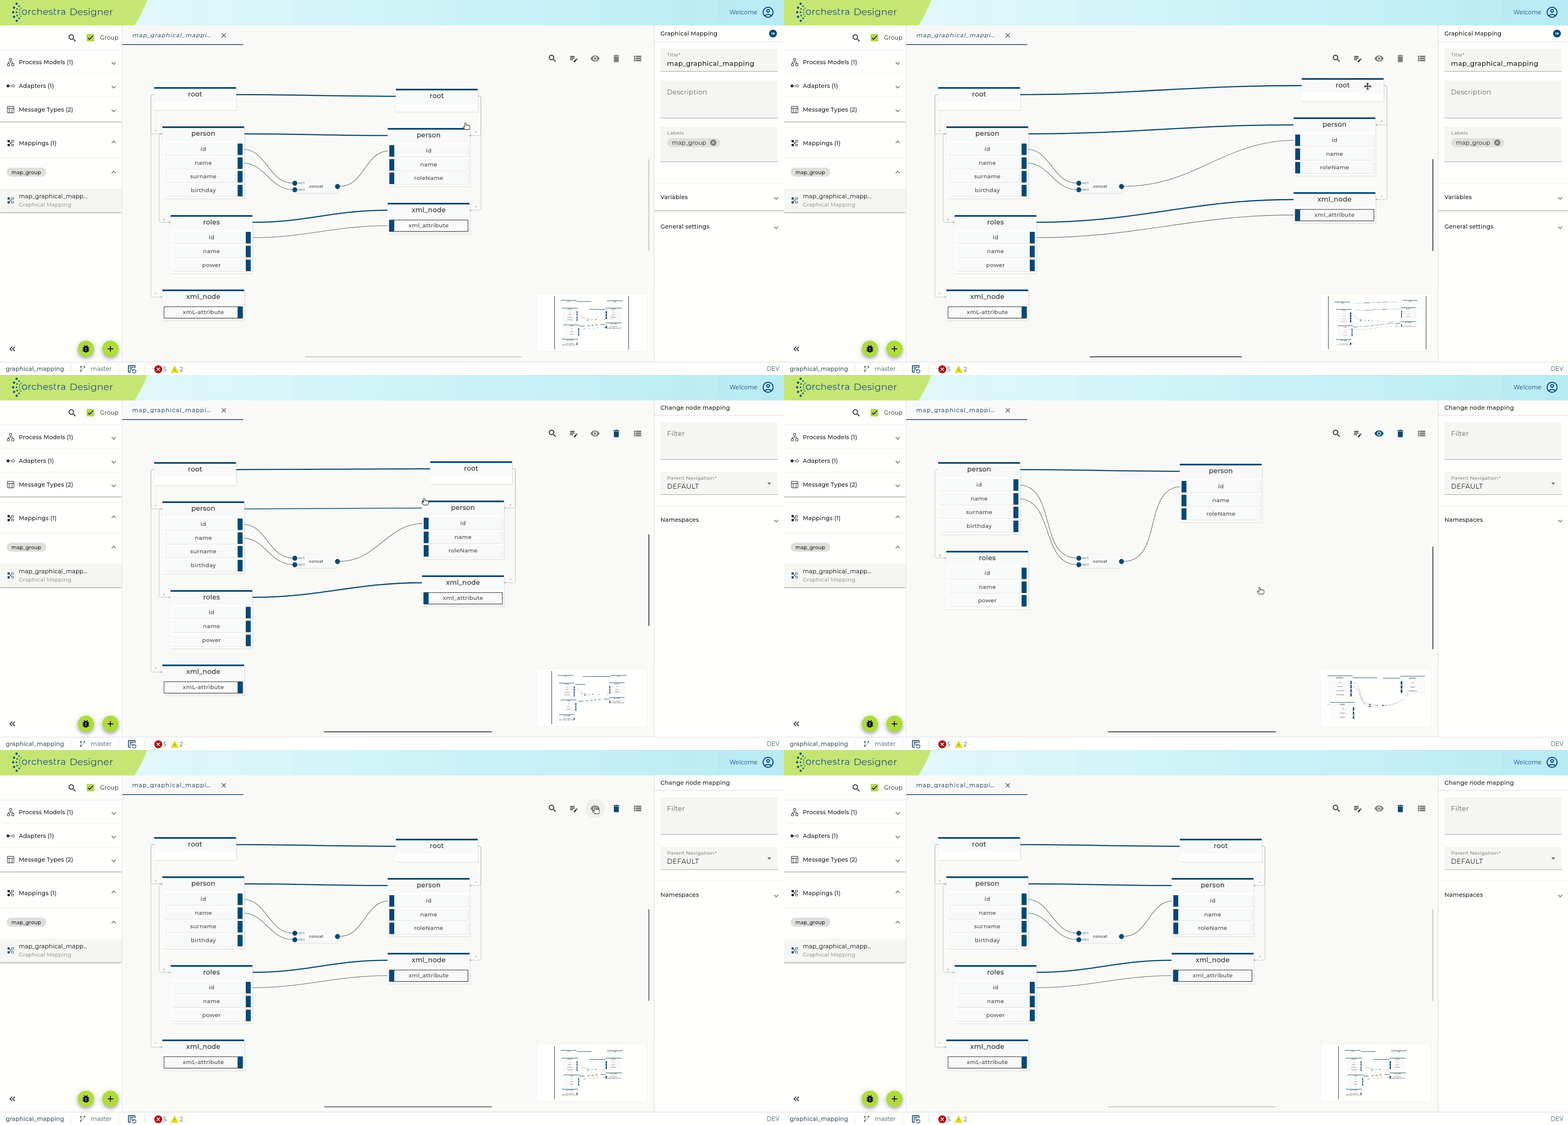
To get a better overview or focus on some specific part of your mapping, you can drag the source & target message apart by clicking & move on the root of the message. This comes in handy if you chain a lot of function between the message types.
Additionally, you are able to focus a specific node mapping & show only its relevant nodes, functions & connections. This can be done by selecting a node mapping & then clicking the eye button to focus it.